Getting Started with NNS: Correlation and Dependence
Fred Viole
Source:vignettes/NNSvignette_03_Correlation_and_Dependence.Rmd
NNSvignette_03_Correlation_and_Dependence.RmdCorrelation and Dependence
The limitations of linear correlation are well known. Often one uses
correlation, when dependence is the intended measure for defining the
relationship between variables. NNS dependence
NNS.dep is a signal:noise measure robust
to nonlinear signals.
Below are some examples comparing NNS correlation
NNS.cor and
NNS.dep with the standard Pearson’s
correlation coefficient cor.
Linear Equivalence
Note the fact that all observations occupy the co-partial moment quadrants.
x = seq(0, 3, .01) ; y = 2 * x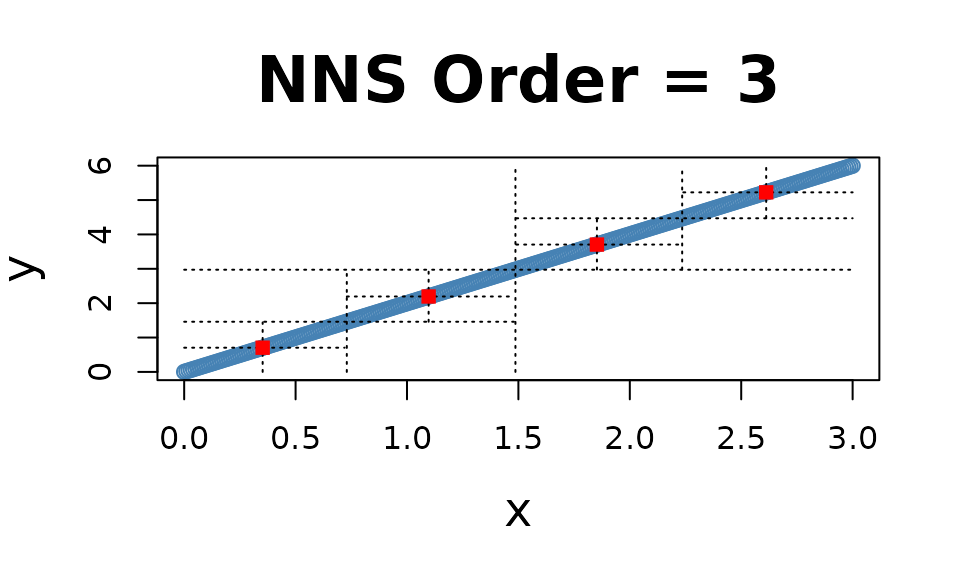
cor(x, y)## [1] 1
NNS.dep(x, y)## $Correlation
## [1] 1
##
## $Dependence
## [1] 1Nonlinear Relationship
Note the fact that all observations occupy the co-partial moment quadrants.
x = seq(0, 3, .01) ; y = x ^ 10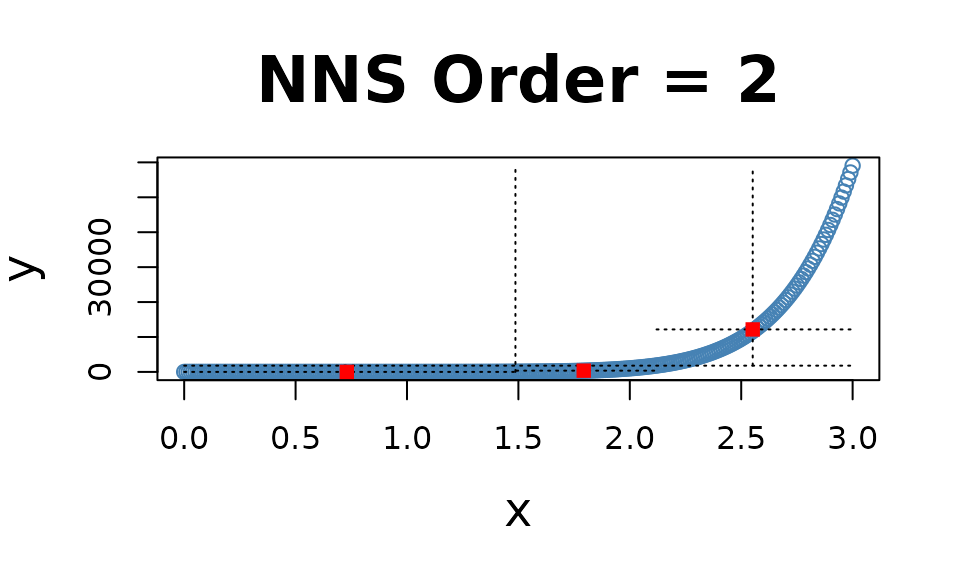
cor(x, y)## [1] 0.6610183
NNS.dep(x, y)## $Correlation
## [1] 0.9169329
##
## $Dependence
## [1] 0.9169329Cyclic Relationship
Even the difficult inflection points, which span both the co- and
divergent partial moment quadrants, are properly compensated for in
NNS.dep.
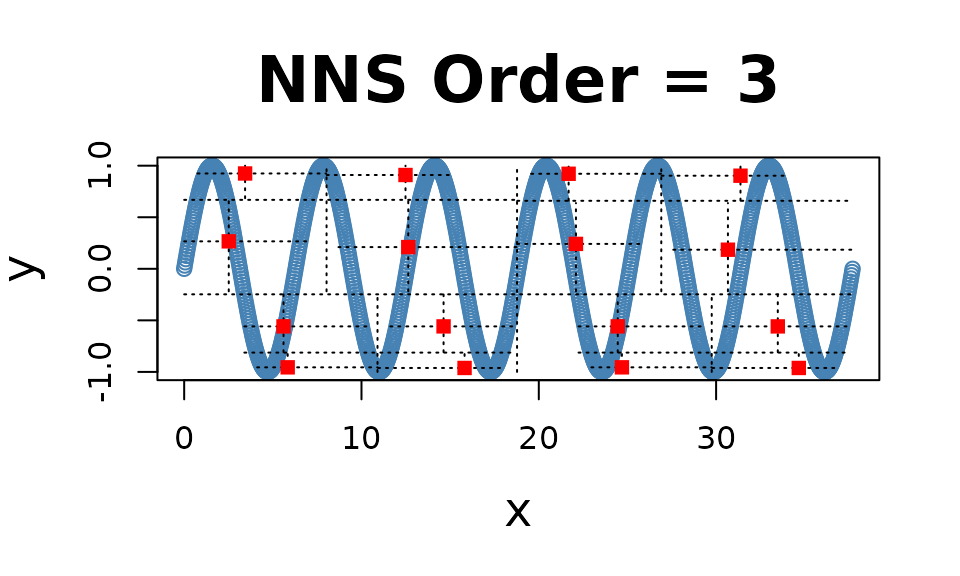
cor(x, y)## [1] -0.1297766
NNS.dep(x, y)## $Correlation
## [1] 0.09141861
##
## $Dependence
## [1] 0.8050198Asymmetrical Analysis
The asymmetrical analysis is critical for further determining a causal path between variables which should be identifiable, i.e., it is asymmetrical in causes and effects.
The previous cyclic example visually highlights the asymmetry of
dependence between the variables, which can be confirmed using
NNS.dep(..., asym = TRUE).
cor(x, y)## [1] -0.1297766
NNS.dep(x, y, asym = TRUE)## $Correlation
## [1] 0.09141861
##
## $Dependence
## [1] 0.8050198
cor(y, x)## [1] -0.1297766
NNS.dep(y, x, asym = TRUE)## $Correlation
## [1] -0.05928228
##
## $Dependence
## [1] 0.05928228Dependence
Note the fact that all observations occupy only co- or divergent partial moment quadrants for a given subquadrant.
set.seed(123)
df = data.frame(x = runif(10000, -1, 1), y = runif(10000, -1, 1))
df = subset(df, (x ^ 2 + y ^ 2 <= 1 & x ^ 2 + y ^ 2 >= 0.95))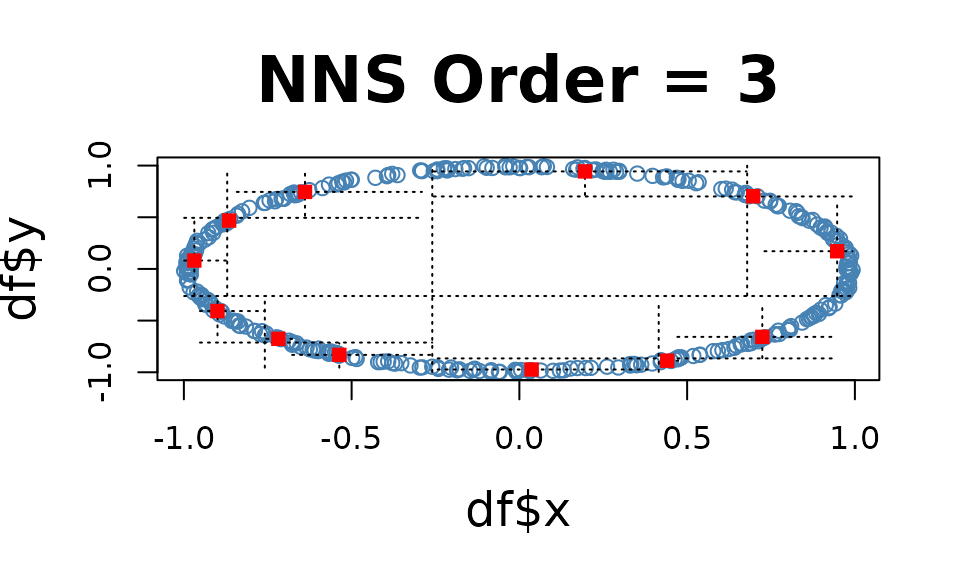
NNS.dep(df$x, df$y)## $Correlation
## [1] -0.05131028
##
## $Dependence
## [1] 0.8634874p-values for NNS.dep()
Permutation p-values and null reference intervals can be obtained by
permuting
and recomputing NNS.dep(x, y_perm). Quantiles of those
shuffled statistics describe the null distribution; they are not
confidence intervals for the original population dependence. The
permutation interpretation requires exchangeability under the null, so
unrestricted shuffling is not automatically appropriate for serial,
clustered, or other dependent observations.
Simply set
NNS.dep(..., p.value = TRUE, print.map = TRUE)
to run 100 permutations and plot the results.
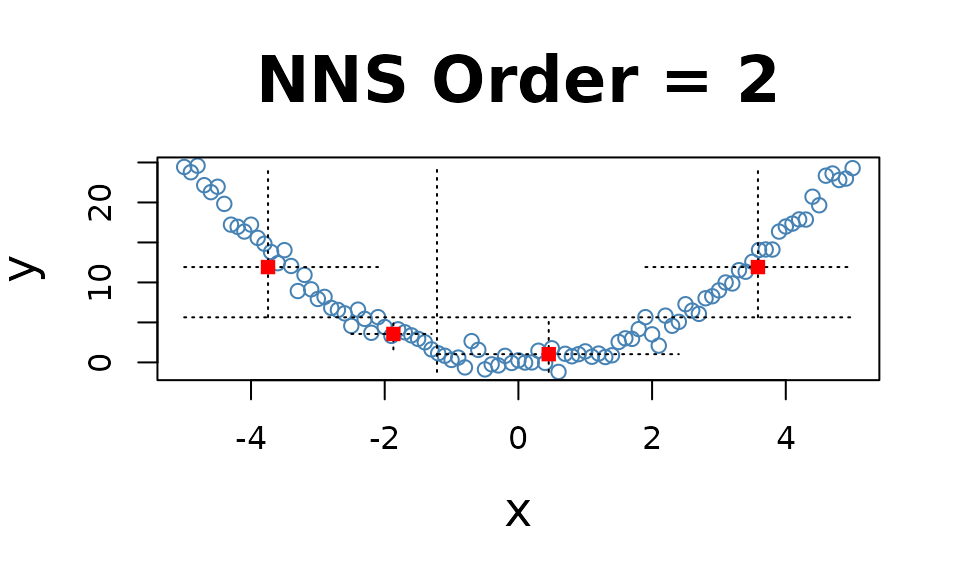
NNS.dep(x, y, p.value = TRUE, print.map = TRUE)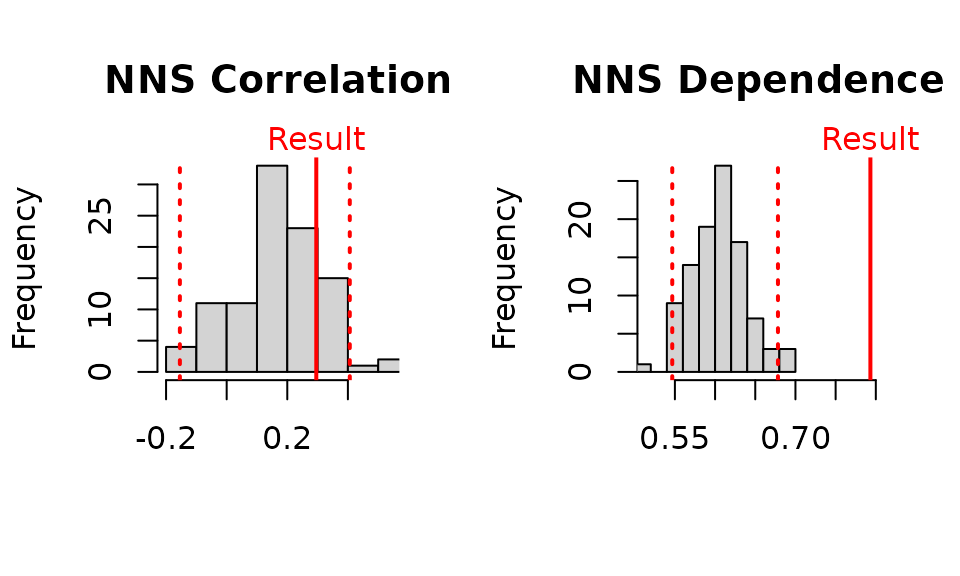
## $Correlation
## [1] 0.002403968
##
## $`Correlation p.value`
## [1] 0.8712871
##
## $`Correlation 95% CIs`
##       2.5%      97.5%
## -0.1996010  0.1585008
##
## $Dependence
## [1] 0.935499
##
## $`Dependence p.value`
## [1] 0.00990099
##
## $`Dependence 95% CIs`
##       2.5%      97.5%
## 0.03359598 0.26350373
Multivariate Dependence NNS.copula()
These partial moment insights permit us to extend the analysis to multivariate instances and deliver a dependence measure such that . This level of analysis is simply impossible with Pearson or other rank based correlation methods, which are restricted to bivariate cases.
set.seed(123)
x = rnorm(1000); y = rnorm(1000); z = rnorm(1000)
NNS.copula(cbind(x, y, z), plot = TRUE, independence.overlay = TRUE)
## [1] 0.1978452